| doc | ||
| gradle/wrapper | ||
| src | ||
| .drone.yml | ||
| .editorconfig | ||
| .gitattributes | ||
| .gitignore | ||
| bitbucket-pipelines.yml | ||
| build.gradle | ||
| CHANGELOG.md | ||
| gradle.properties | ||
| gradlew | ||
| gradlew.bat | ||
| LICENSE | ||
| README.md | ||
| settings.gradle | ||
| TODO.md | ||
HMC Insights
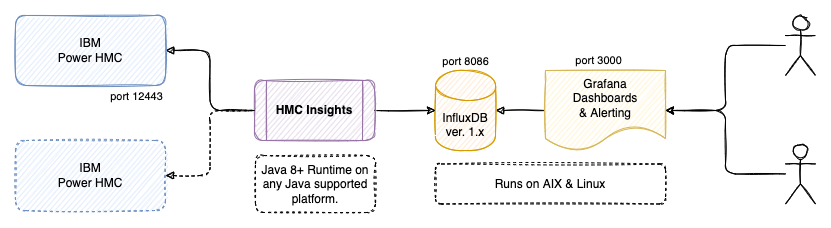
HMCi is a utility that collects metrics from one or more IBM Power Hardware Management Consoles (HMC), without the need to install agents on logical partitions / virtual machines running on the IBM Power systems. The metric data is processed and saved into an InfluxDB time-series database. Grafana is used to visualize the metrics data from InfluxDB through provided dashboards, or your own customized dashboards.
This software is free to use and is licensed under the Apache 2.0 License, but is not supported or endorsed by International Business Machines (IBM). There is an optional companion agent, which provides more metrics from within AIX and Linux.
Metrics includes:
- Managed Systems - the physical Power servers
- Logical Partitions - the virtualized servers running AIX, Linux or IBM-i (AS/400)
- Virtual I/O Servers - the i/o partition(s) virtualizing network and storage
- Energy - watts and temperatures (needs to be enabled and is not available on P7 and multi-chassis systems)
Some of my other related projects are:
- svci for monitoring IBM Spectrum Virtualize (Flashsystems / Storwize / SVC)
- sysmon for monitoring all types of servers with a small Java agent
- syslogd for redirecting syslog and GELF to remote logging destinations
Installation and Setup
There are few steps in the installation.
- Preparations on the Hardware Management Console (HMC)
- Installation of InfluxDB and Grafana software
- Installation and configuration of HMC Insights (HMCi)
- Configure Grafana and import example dashboards
1 - IBM Power HMC Setup Instructions
- Login to your HMC
- Navigate to Console Settings
- Go to Change Date and Time
- Set correct timezone, if not done already
- Configure one or more NTP servers, if not done already
- Enable the NTP client, if not done already
- Go to Change Date and Time
- Navigate to Users and Security
- Create a new read-only/viewer hmci user, which will be used to connect to the HMC.
- Click Manage User Profiles and Access, edit the newly created hmci user and click User Properties:
- Set Session timeout minutes to 60
- Set Verify timeout minutes to 15
- Set Idle timeout minutes to 90
- Set Minimum time in days between password changes to 0
- Enable Allow remote access via the web
- Navigate to HMC Management and Console Settings
- Click Change Performance Monitoring Settings:
- Enable Performance Monitoring Data Collection for Managed Servers: All On
- Set Performance Data Storage to 1 day or preferable more
- Click Change Performance Monitoring Settings:
If you do not enable Performance Monitoring Data Collection for Managed Servers, you will see errors such as Unexpected response: 403. Use the HMCi debug option to get more details about what is going on.
2 - InfluxDB and Grafana Installation
Install InfluxDB (v. 1.8.x or 1.9.x for best compatibility with Grafana) on a host which is network accessible by the HMCi utility (the default InfluxDB port is 8086). You can install Grafana on the same server or any server which are able to connect to the InfluxDB database. The Grafana installation needs to be accessible from your browser (default on port 3000). The default settings for both InfluxDB and Grafana will work fine as a start.
- You can download Grafana ppc64le and InfluxDB ppc64le packages for most Linux distributions and AIX on the Power DevOps site.
- Binaries for amd64/x86 are available from the Grafana website (select the OSS variant) and InfluxDB website and most likely directly from your Linux distributions repositories.
- Create the empty hmci database by running the influx CLI command and type:
CREATE DATABASE "hmci" WITH DURATION 365d REPLICATION 1;
See the Influx documentation for more information on duration and replication.
3 - HMCi Installation & Configuration
Install HMCi on a host, that can connect to your Power HMC (on port 12443), and is also allowed to connect to the InfluxDB service. This can be the same LPAR/VM as used for the InfluxDB installation.
- Ensure you have correct date/time and NTPd running to keep it accurate!
- The only requirement for hmci is the Java runtime, version 8 (or later)
- Install HMCi from downloads (rpm, deb or jar) or build from source
- On RPM based systems:
sudo rpm -ivh hmci-x.y.z-n.noarch.rpm - On DEB based systems:
sudo dpkg -i hmci_x.y.z-n_all.deb
- On RPM based systems:
- Copy the /opt/hmci/doc/hmci.toml configuration example into /etc/hmci.toml and edit the configuration to suit your environment. The location of the configuration file can optionally be changed with the --conf option.
- Run the /opt/hmci/bin/hmci program in a shell, as a @reboot cron task or configure as a proper service - there are instructions in the doc/readme-service.md file.
- When started, hmci expects the InfluxDB database to exist already.
4 - Grafana Configuration
- Configure Grafana to use InfluxDB as a new datasource
- NOTE: set Min time interval to 30s or 1m depending on your HMCi refresh setting.
- Import example dashboards from doc/dashboards/*.json into Grafana as a starting point and get creative making your own cool dashboards - please share anything useful :)
Notes
No data (or past/future data) shown in Grafana
This is most likely due to timezone, date and/or NTP not being configured correctly on the HMC and/or host running HMCi.
Example showing how you configure related settings through the HMC CLI:
chhmc -c date -s modify --datetime MMDDhhmm           # Set current date/time: MMDDhhmm[[CC]YY][.ss]
chhmc -c date -s modify --timezone Europe/Copenhagen  # Configure your timezone
chhmc -c xntp -s enable                               # Enable the NTP service
chhmc -c xntp -s add -a IP_Addr                       # Add a remote NTP server
Remember to reboot your HMC after changing the timezone.
Compatibility with nextract Plus
From version 1.2 HMCi is made compatible with the similar nextract Plus tool from Nigel Griffiths. This means that the Grafana dashboards made by Nigel are compatible with HMCi and the other way around.
Start InfluxDB and Grafana at boot (systemd compatible Linux)
systemctl enable influxdb
systemctl start influxdb

systemctl enable grafana-server
systemctl start grafana-server
InfluxDB Retention Policy
Examples for changing the default InfluxDB retention policy for the hmci database:
ALTER RETENTION POLICY "autogen" ON "hmci" DURATION 156w
ALTER RETENTION POLICY "autogen" ON "hmci" DURATION 90d
Upgrading HMCi
On RPM based systems (RedHat, Suse, CentOS), download the latest hmci-x.y.z-n.noarch.rpm file and upgrade:
sudo rpm -Uvh hmci-x.y.z-n.noarch.rpm
On DEB based systems (Debian, Ubuntu and derivatives), download the latest hmci_x.y.z-n_all.deb file and upgrade:
sudo dpkg -i hmci_x.y.z-n_all.deb
Restart the HMCi service on systemd based Linux systems:
systemctl restart hmci
journalctl -f -u hmci  # to check log output
AIX Notes
To install (or upgrade) on AIX, you need to pass the --ignoreos flag to the rpm command:
rpm -Uvh --ignoreos hmci-x.y.z-n.noarch.rpm
Dashboard Screenshots
Screenshots of some of the provided Grafana dashboards can be found in the doc/screenshots/ folder.
Known problems
Incomplete set of metrics
I have not been able to test and verify all types of metric data. If you encounter any missing or wrong data, please contact me and I will try to fix it.
It is possible to save the raw JSON data received from the HCM, which can help me implement missing data. You need to specify trace = "/tmp/hmci-trace" or some other location, in the configuration file under the HMC instance.
Naming collision
You can't have partitions (or Virtual I/O Servers) on different Systems with the same name, as these cannot be distinguished when metrics are written to InfluxDB (which uses the name as key).
Renaming partitions
If you rename a partition, the metrics in InfluxDB will still be available by the old name, and new metrics will be available by the new name of the partition. There is no easy way to migrate the old data, but you can delete it easily:
DELETE WHERE lparname = 'name';
Development Information
You need Java (JDK) version 8 or later to build hmci.
Build & Test
Use the gradle build tool, which will download all required dependencies:
./gradlew clean build
Local Testing
InfluxDB
Start the InfluxDB container:
docker run --name=influxdb --rm -d -p 8086:8086 influxdb:1.8
Create the hmci database:
docker exec -i influxdb influx -execute "CREATE DATABASE hmci"
Grafana
Start the Grafana container, linking it to the InfluxDB container:
docker run --name grafana --link influxdb:influxdb --rm -d -p 3000:3000 grafana/grafana
Setup Grafana to connect to the InfluxDB container by defining a new datasource on URL http://influxdb:8086 named hmci.
Grafana dashboards can be imported from the doc/ folder.