6.3 KiB
Spectrum Virtualize Insights / SVCi
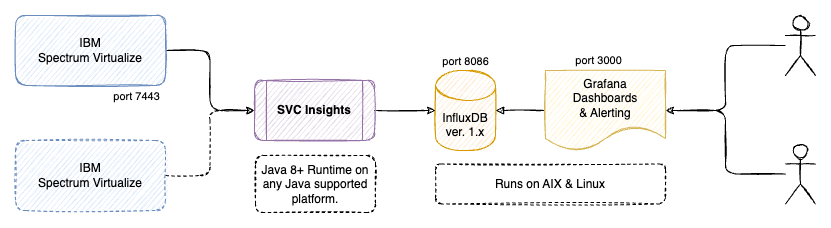
SVCi is a utility that collects metrics from one or more IBM SAN Volume Controllers. The metric data is processed and saved into an InfluxDB time-series database. Grafana is used to visualize the metrics data from InfluxDB through provided dashboards, or your own customized dashboards.
This software is free to use and is licensed under the Apache 2.0 License, but is not supported or endorsed by International Business Machines (IBM).
Some of my other related projects are:
- hmci for agent-less monitoring of IBM Power servers
- sysmon for monitoring all types of servers with a small Java agent
- syslogd for redirecting syslog and GELF to remote logging destinations
Screenshots
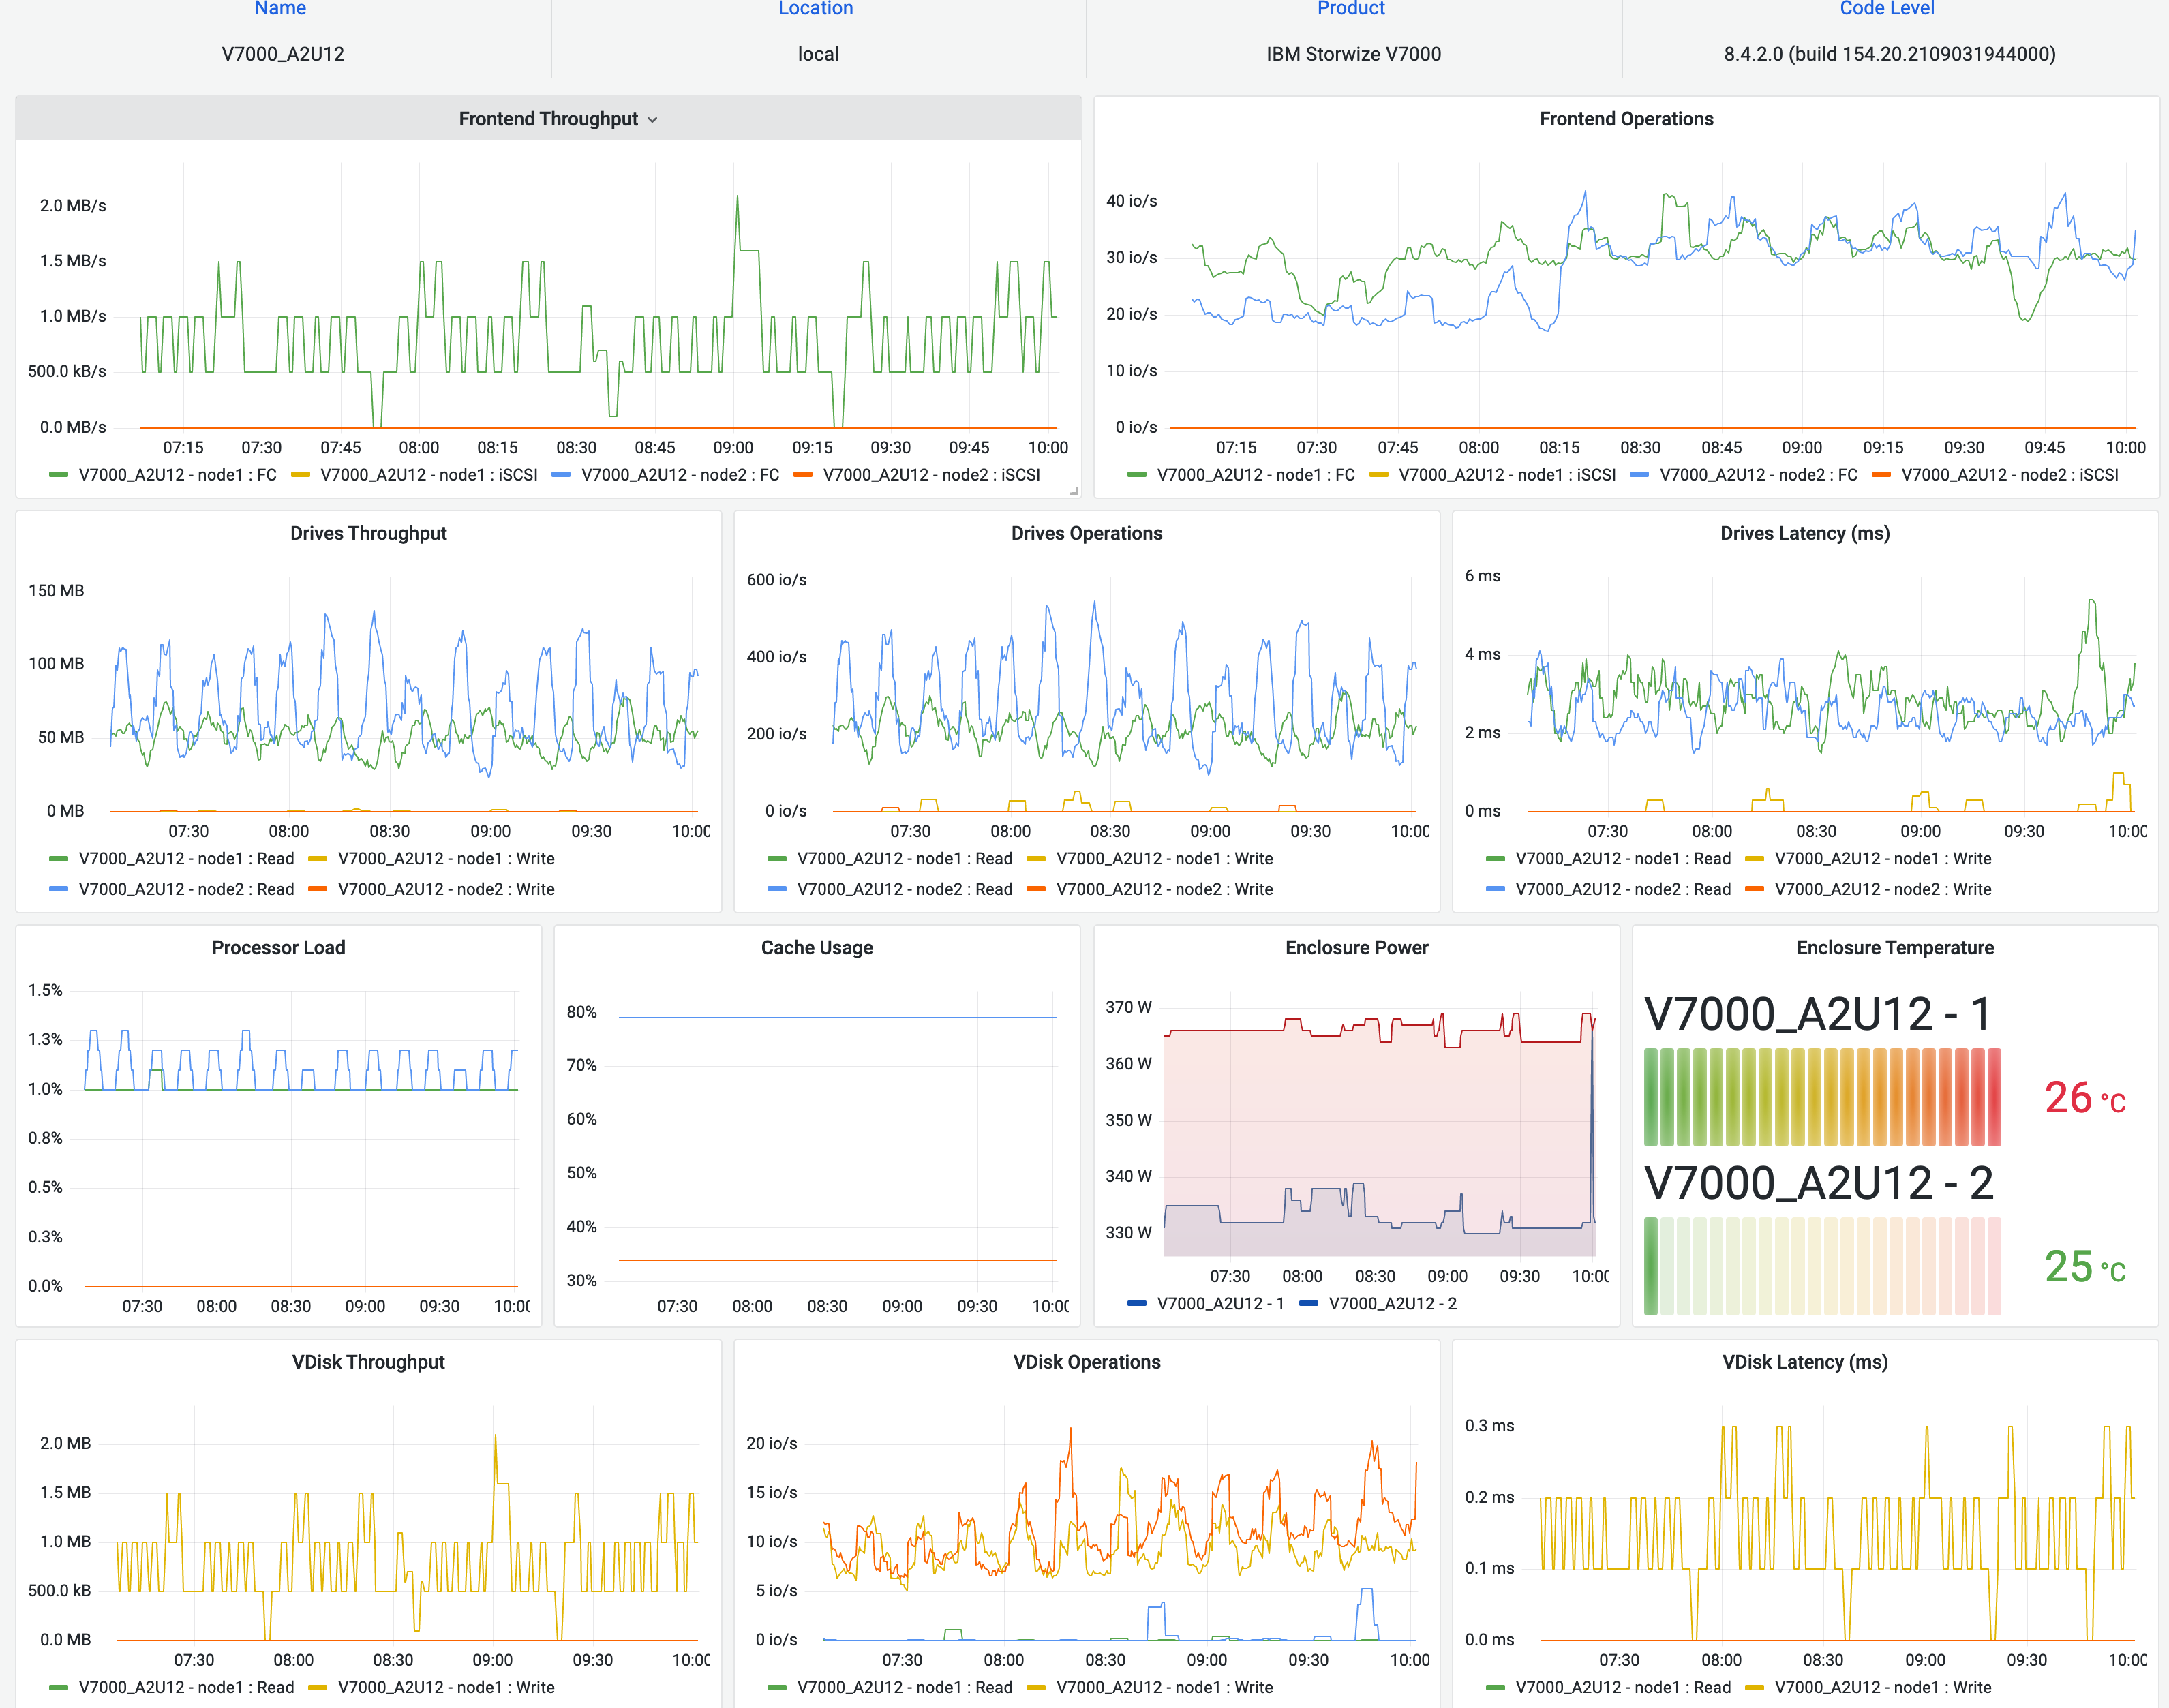
More screenshots can be found in the doc/screenshots/ folder.
Installation and Setup
There are few steps in the installation.
- Prepare your Spectrum Virtualize
- Installation of InfluxDB and Grafana software
- Installation and configuration of SVC Insights (SVCi)
- Configure Grafana and import example dashboards
1 - Prepare Spectrum Virtualize
- Create a user with the "Monitor" role
- To start extended statistics, the user must be in the "Administrator" role (svctask startstats -interval 30)
2 - InfluxDB and Grafana Installation
Install InfluxDB (v. 1.8 or later) on a host which is network accessible by the SVCi utility (the default InfluxDB port is 8086). You can install Grafana on the same server or any server which are able to connect to the InfluxDB database. The Grafana installation needs to be accessible from your browser (default on port 3000). The default settings for both InfluxDB and Grafana will work fine as a start.
- Create the empty svci database by running the influx CLI command and type:
CREATE DATABASE "svci" WITH DURATION 365d REPLICATION 1;
See the Influx documentation for more information on duration and replication.
3 - SVCi Installation & Configuration
Install SVCi on a host, that can connect to your SAN Volume Controllers (on port 7443), and is also allowed to connect to the InfluxDB service. This can be the same LPAR/VM as used for the InfluxDB installation.
- Ensure you have correct date/time and NTPd running to keep it accurate!
- The only requirement for svci is the Java runtime, version 8 (or later)
- Install SVCi from from packages (rpm, deb or jar) or build from source
- On RPM based systems:
sudo rpm -ivh svci-x.y.z-n.noarch.rpm - On DEB based systems:
sudo dpkg -i svci_x.y.z-n_all.deb
- On RPM based systems:
- Copy the /opt/svci/doc/svci.toml configuration example into /etc/svci.toml and edit the configuration to suit your environment. The location of the configuration file can optionally be changed with the --conf option.
- Run the /opt/svci/bin/svci program in a shell, as a @reboot cron task or configure as a proper service - there are instructions in the doc/ folder.
- When started, svci expects the InfluxDB database to exist already.
4 - Grafana Configuration
- Configure Grafana to use InfluxDB as a new datasource
- NOTE: set Min time interval depending on your SVCi refresh setting.
- Import example dashboards from doc/dashboards/*.json into Grafana as a starting point and get creative making your own cool dashboards - please share anything useful :)
Notes
No data (or past/future data) shown in Grafana
This is most likely due to timezone, date and/or NTP not being configured correctly on the SAN Volune Controller and/or host running SVCi.
InfluxDB Retention Policy
Examples for changing the default InfluxDB retention policy for the svci database:
ALTER RETENTION POLICY "autogen" ON "svci" DURATION 156w
ALTER RETENTION POLICY "autogen" ON "svci" DURATION 90d
Upgrading SVCi
On RPM based systems (RedHat, Suse, CentOS), download the latest svci-x.y.z-n.noarch.rpm file and upgrade:
sudo rpm -Uvh svci-x.y.z-n.noarch.rpm
On DEB based systems (Debian, Ubuntu and derivatives), download the latest svci_x.y.z-n_all.deb file and upgrade:
sudo dpkg -i svci_x.y.z-n_all.deb
Restart the SVCi service on systemd based Linux systems:
systemctl restart svci
journalctl -f -u svci  # to check log output
AIX Notes
To install (or upgrade) on AIX, you need to pass the --ignoreos flag to the rpm command:
rpm -Uvh --ignoreos svci-x.y.z-n.noarch.rpm
Screenshots
Screenshots of the provided Grafana dashboard can be found in the doc/screenshots/ folder.
Development Information
You need Java (JDK) version 8 or later to build svci.
Build & Test
Use the gradle build tool, which will download all required dependencies:
./gradlew clean build
Local Testing
InfluxDB v1.x
Start a InfluxDB container:
docker run --name=influxdb --rm -d -p 8086:8086 influxdb:1.8
Create the svci database:
docker exec -i influxdb influx -execute "CREATE DATABASE svci"
InfluxDB v2.x
Start a InfluxDB container:
docker run --name=influxdb --rm -d -p 8086:8086 influxdb:latest
- Then use the Web UI to create an initial user (for the web UI), an organization and bucket: http://localhost:8086/
- Then create an API token with RW access to your bucket.
Grafana
Start a Grafana container, linking it to the InfluxDB container:
docker run --name grafana --link influxdb:influxdb --rm -d -p 3000:3000 grafana/grafana
Setup Grafana to connect to the InfluxDB container by defining a new datasource on URL http://influxdb:8086 named svci.
If you are connecting to InfluxDB v2.x, then add a custom http header, enter bucket as database and disable authorization.
- Authorization = Token abcdef_random_token_from_nfluxdb==
- Import dashboards from the doc/dashboards/ folder.