Open source, cross-platform, client/server based systems monitoring solution. Reads the usual metrics such as cpu, disk i/o and network, but also allows for plugins and scripts to extend the functionality. Metrics for shared processor utilization on IBM Power is also measured. The clients need only Java and sends metrics to the server (through HTTP), which stores these in InfluxDB for display through Grafana. https://github.com/mnellemann/sysmon
Go to file
Mark Nellemann 8bc02798d2 Add doc on installation on rpm Linux systems 2022-09-19 14:18:42 +02:00
client Add doc on installation on rpm Linux systems 2022-09-19 14:18:42 +02:00
doc Update doc/instructions. 2022-09-19 14:15:48 +02:00
gradle/wrapper Cleanup and updates to README files. 2022-02-16 12:34:51 +01:00
plugins Update doc/instructions. 2022-09-19 14:15:48 +02:00
server Update doc/instructions. 2022-09-19 14:15:48 +02:00
shared Update dashboard to include system information and only submit this once an hour per. default. 2022-09-06 15:08:52 +02:00
.editorconfig Add editorconfig settings. 2022-04-20 12:33:37 +02:00
.gitattributes Initial commit, work in progress 2021-04-25 15:25:20 +02:00
.gitignore Update oshi library and bump version. 2022-06-27 08:04:25 +02:00
CHANGELOG.md Dashboard updates 2022-08-20 10:02:05 +02:00
LICENSE Improve robustness, logging and example dashboards 2021-09-22 15:46:48 +02:00
README.md Update 3rd party dependencies. 2022-08-09 10:36:19 +02:00
bitbucket-pipelines.yml Cleanup and initial test of build pipeline. 2021-05-21 17:00:47 +02:00
build.gradle Update documentation on sysv init script setup. 2022-08-27 10:30:18 +02:00
gradle.properties Update dashboard to include system information and only submit this once an hour per. default. 2022-09-06 15:08:52 +02:00
gradlew Misc. small changes. 2021-12-05 21:17:16 +01:00
gradlew.bat Initial commit, work in progress 2021-04-25 15:25:20 +02:00
settings.gradle Refactoring of component names. 2021-05-07 12:39:55 +02:00

README.md

System Monitor

System monitoring solution with support for plugins.

Sysmon Icon

This software is free to use and is licensed under the Apache 2.0 License.

  • Example dashboards are provided in the doc/ folder, which can be imported into your Grafana installation.
  • Screenshots are available in the downloads section.
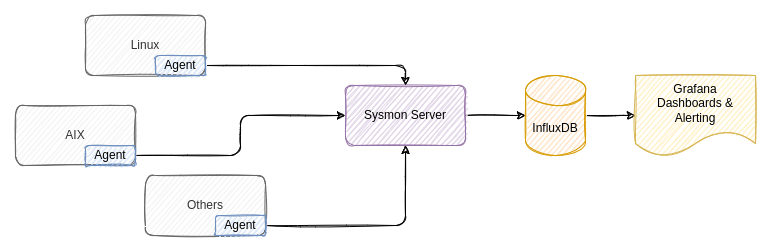
Components

Client / Agent

Runs on your hosts and collects metrics, which are sent to the central server.

More information.

Plugins

Loaded by the client and provides extensions for doing the actual collecting of metrics.

More information.

Server

Receives aggregated metrics from clients and saves these into InfluxDB.

More information.

Known problems

Correct timezone and clock

  • Ensure you have correct timezone and date/time and NTPd (or similar) running to keep it accurate!

Naming collision

You can't have hosts with the same name, as these cannot be distinguished when metrics are written to InfluxDB (which uses the hostname as key).

Renaming hosts

If you rename a host, the metrics in InfluxDB will still be available by the old hostname, and new metrics will be written with the new hostname. There is no easy way to migrate the old data, but you can delete it easily:

USE sysmon;
DELETE WHERE hostname = 'unknown';