2.3 KiB
System Monitor
Open source system monitoring solution with support for plugins and scripts.
This software is free to use and is licensed under the Apache 2.0 License.
- Example dashboards are provided in the doc/dashboards/ folder, which can be imported into your Grafana installation.
- Screenshots of some of the default dashboards are available in doc/screenshots section.
Some of my other related projects are:
- hmci for agent-less monitoring of IBM Power servers
- svci for monitoring IBM Spectrum Virtualize (Flashsystems / Storwize / SVC)
- syslogd for redirecting syslog and GELF to other logging destinations
Screenshots
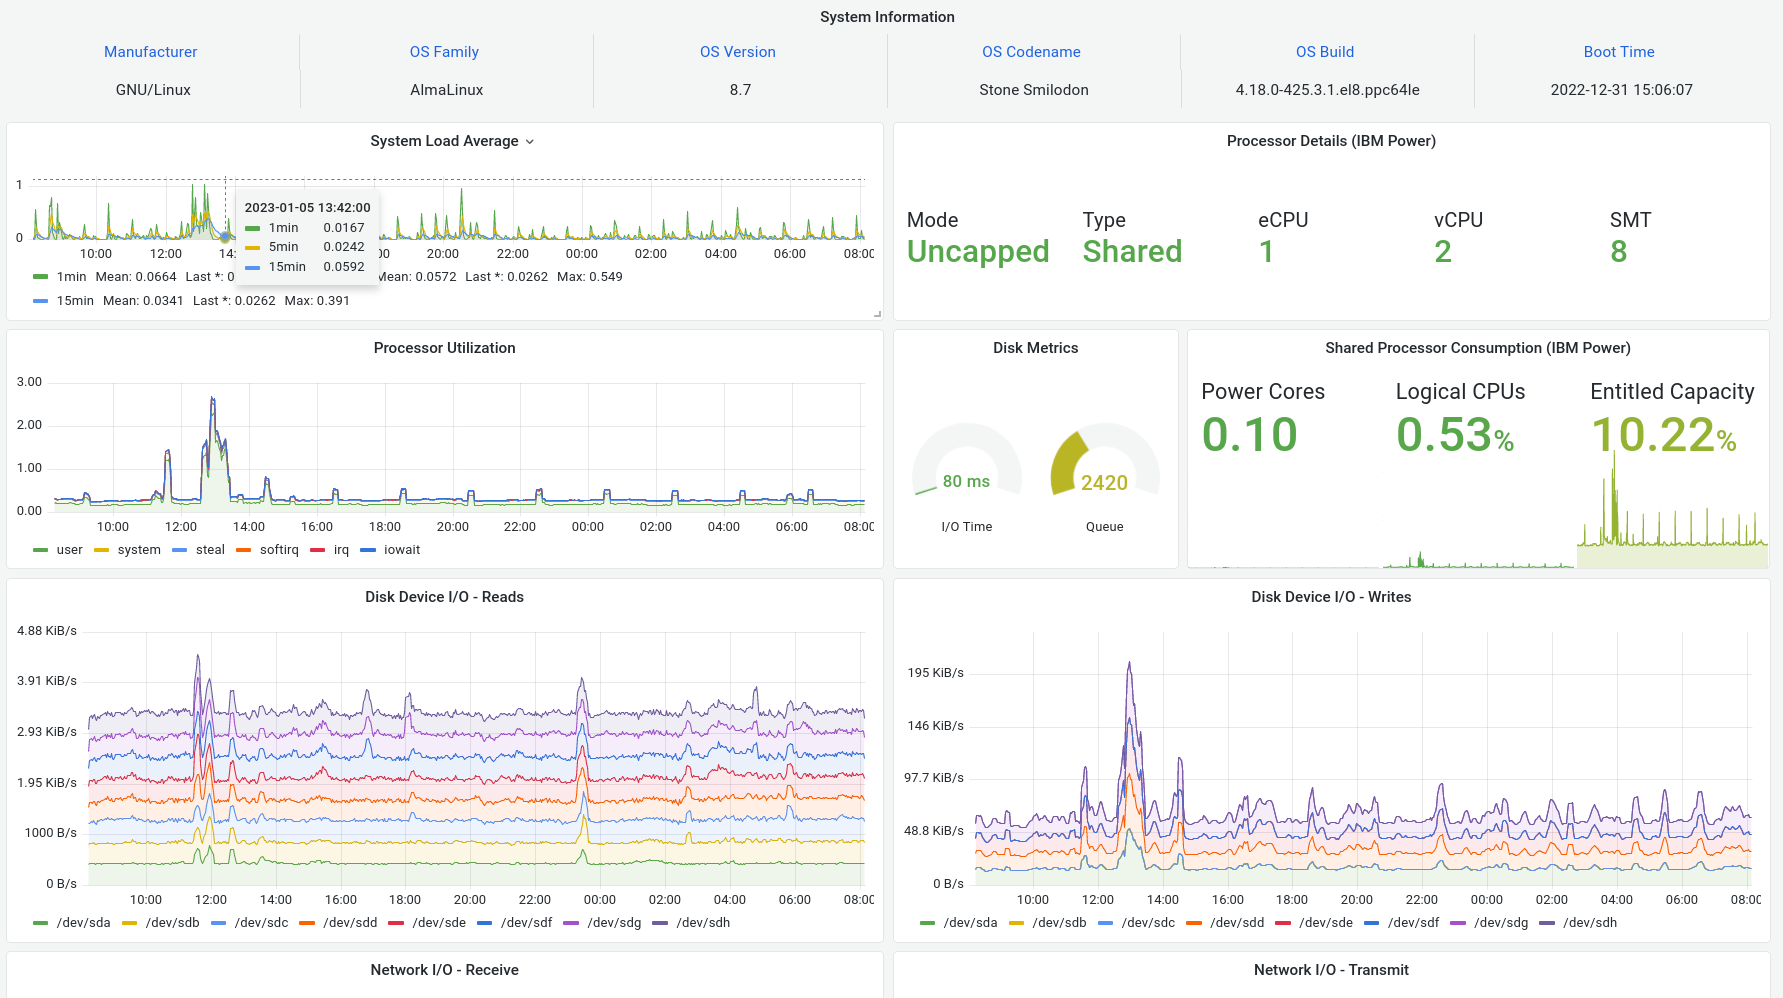
Screenshots of other dashboards are available in the doc/screenshots folder.
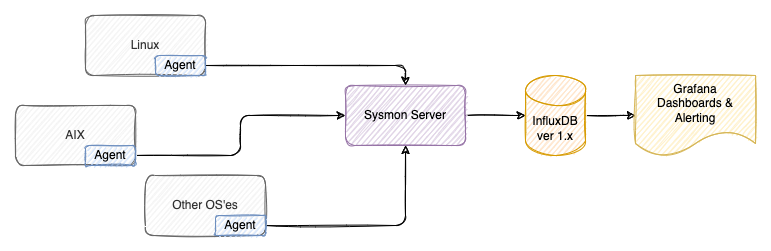
Components
Server
The server component receives aggregated metrics from clients and saves these into InfluxDB.
- Downloaded from packages.
- More information and documentation on the sysmon-server.
Client & Plugins
The client runs on all or some of your hosts and collects metrics, which are then sent to the central sysmon-server component. Plugins are loaded by the client at startup and should also be installed.
- Downloaded from packages.
- More information and documentation on the sysmon-client. . More information and documentation on the sysmon-plugins.
Known problems
Correct timezone and clock
- Ensure you have correct timezone and date/time and NTPd (or similar) running to keep it accurate!
Naming collision
You can't have hosts with the same name, as these cannot be distinguished when metrics are written to InfluxDB (which uses the hostname as key).
Renaming hosts
If you rename a host, the metrics in InfluxDB will still be available by the old hostname, and new metrics will be written with the new hostname. There is no easy way to migrate the old data, but you can delete it easily:
USE sysmon;
DELETE WHERE hostname = 'unknown';